Using RSI and MACD with Classic Chart Patterns
Classic chart patterns like head and shoulders or wedges can be powerful but may produce false signals. By combining them with RSI and MACD, traders can improve accuracy and confirm true breakouts.
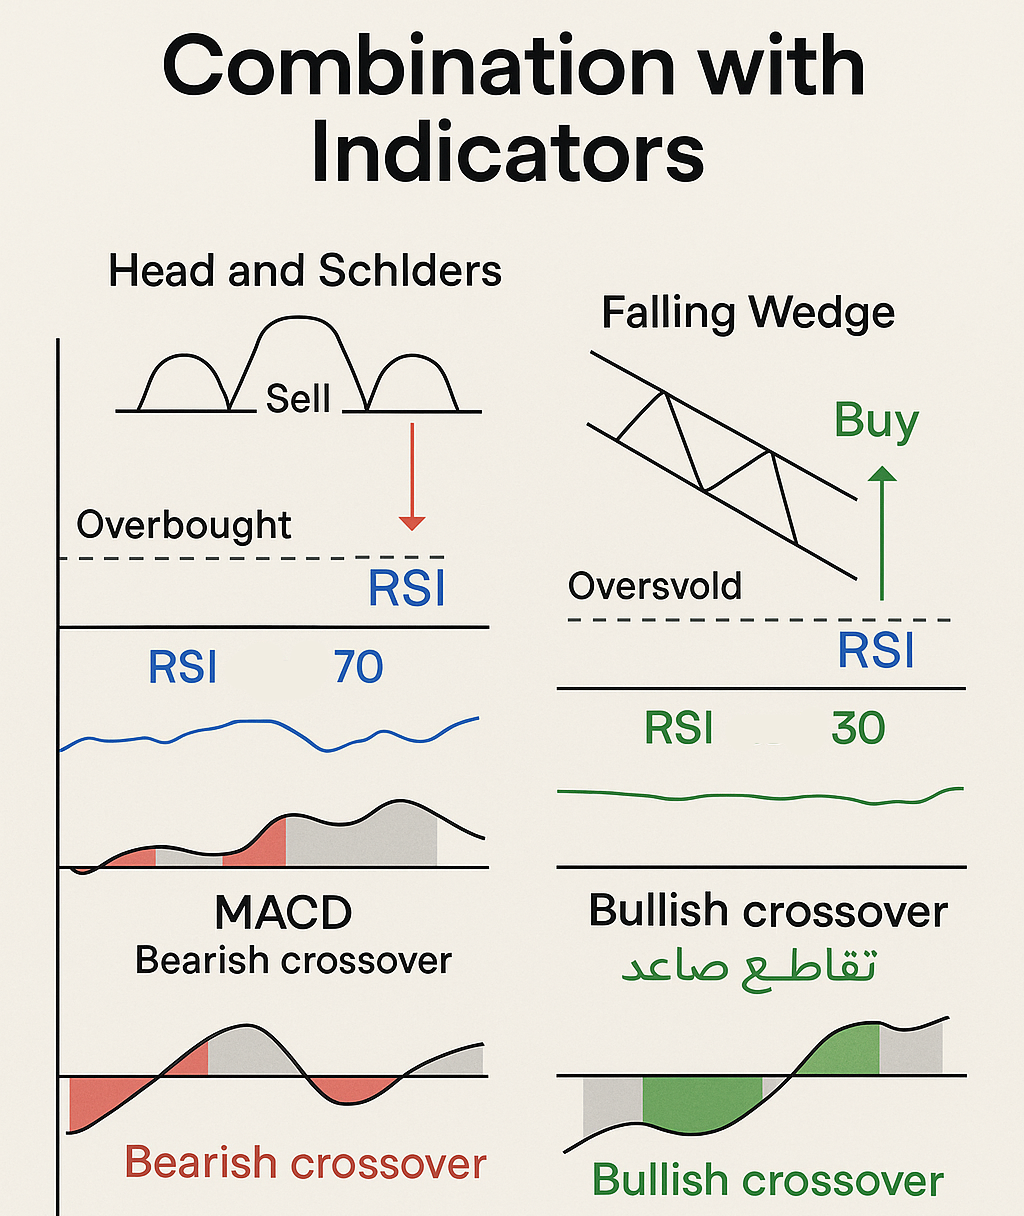
RSI (Relative Strength Index)
RSI measures momentum between 0–100. Overbought above 70, oversold below 30.
Pattern + RSI:
- Bearish head and shoulders + RSI overbought = stronger signal.
- Bullish falling wedge + RSI oversold = stronger confirmation.
MACD (Moving Average Convergence Divergence)
MACD uses moving averages and histogram for momentum analysis.
Pattern + MACD:
- Rising wedge + MACD bearish crossover = strong sell.
- Inverse head and shoulders + MACD bullish crossover = strong buy.
Step-by-Step Strategy
- Identify the chart pattern.
- Check RSI for confirmation.
- Check MACD crossover/histogram.
- Trade only if all align.
Conclusion
Combining RSI and MACD with chart patterns filters noise and increases trading reliability. Learn more from RSI and MACD.