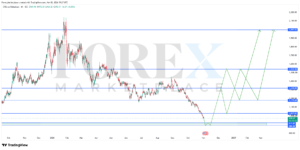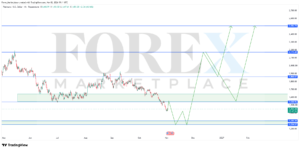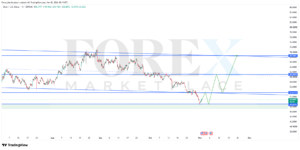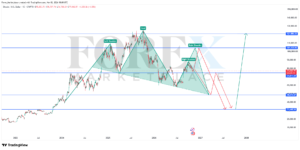

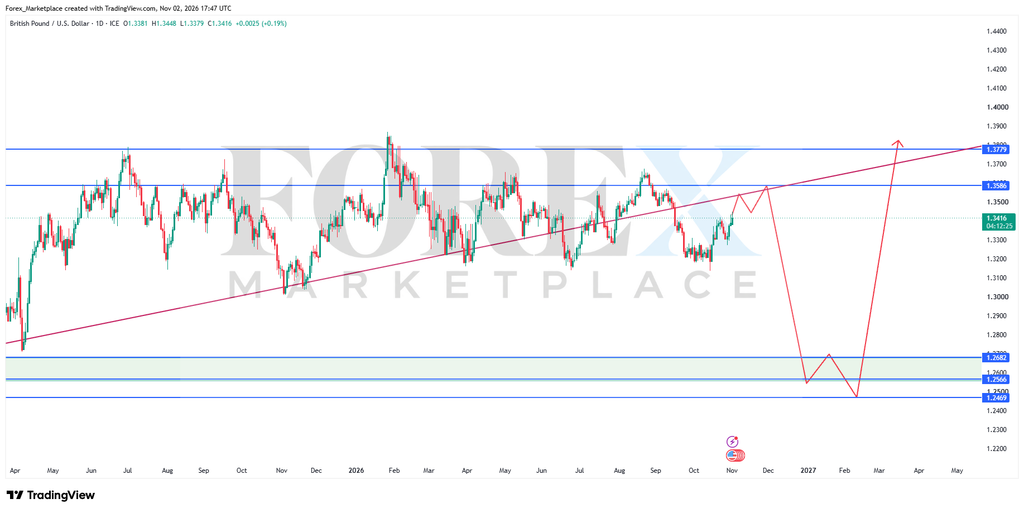
Today’s GBP/USD analysis (Monday, 2 November 2026) reviews the British pound against the U.S. dollar (GBP/USD) on the daily timeframe. The pair is currently trading near 1.3416, with a technical scenario combining a short-term rise and a deeper correction before a wider upward move.
📊 Levels Map
▲ Bullish scenario
Medium term: the 1.2469 – 1.2682 zone is the most important; a bounce from it favors the move toward 1.3779.
▼ Invalidation scenario
Invalidation: a break and close below 1.2469 breaks the ascending trendline and changes the pair’s overall picture.
GBP/USD at a glance
- Current price: around 1.3416 (+0.19%).
- Resistance levels: 1.3586, then 1.3779.
- Key support zone: 1.2682 – 1.2566 – 1.2469.
- Trend: above a long-term ascending trendline, with a possible mid correction.
Key technical levels
| Level | Value | Significance |
|---|---|---|
| Upper resistance (farther target) | 1.3779 | Main upside target |
| Near resistance | 1.3586 | First obstacle to the upside |
| Current price | 1.3416 | Current trading zone |
| Support zone (upper) | 1.2682 – 1.2566 | Start of the strong demand zone |
| Major support | 1.2469 | Zone bottom and trendline confluence |
The technical scenario
The technical scenario points to a possible short-term rise to test resistance at 1.3586, followed by a deeper correction toward the strong support zone between 1.2469 and 1.2682, then a major upward move targeting 1.3779.
Factors affecting GBP/USD
The pair is driven by the divergence between the Bank of England and the U.S. Federal Reserve, and by inflation, growth, and employment data in the UK and the US. Dollar strength after the Fed’s latest decision remains a near-term headwind.
Bottom line
Today’s GBP/USD analysis favors a rise toward 1.3586 then a correction toward the 1.2469 – 1.2682 support zone, from which an upward move toward 1.3779 is expected as long as it holds. Watching price’s reaction at these zones and central bank data remains the priority.
Frequently asked questions
GBP/USD is trading today near 1.3416 on the daily timeframe, between resistance at 1.3586 and a support zone at 1.2469 – 1.2682.
A rise to test 1.3586, then a correction toward the 1.2469 – 1.2682 support zone, then an upward move targeting 1.3779.
A break and close below 1.2469 breaks the ascending trendline and changes the pair’s overall picture.
This content is for educational and informational purposes only and is not investment advice. Trading currencies involves risk; make your decisions based on your own circumstances and consult a professional if needed.