
Gold Price Today, November 4, 2026: XAU/USD Firms Near $3,935 as US Election Results Loom
Gold prices opened early Asian trading modestly higher after a volatile Tuesday session, as investors reassessed lower oil prices, Federal Reserve expectations and the developing US midterm election results. Meanwhile, new World Gold Council data highlight strong official-sector buying and an unusual rise in Egyptian investment demand.
Gold Price Today: What Changed Overnight?
Spot gold advanced 0.2% to $3,934.75 per troy ounce at 00:24 UTC on Wednesday, November 4, 2026, according to Reuters. US gold futures for December delivery were also slightly higher, adding 0.1% to $3,943.20.
The early recovery followed a weaker Tuesday session. At 19:06 UTC on November 3, spot gold was trading 0.5% lower at $3,927.18, after earlier falling to $3,893.31.
The contrast illustrates the market’s sensitivity to changing macroeconomic expectations. These are historical observations at specific times, however, and should not be interpreted as live prices or Wednesday’s final closing levels.
Gold moved from selling pressure during the US session to a modest gain in early Asia. The move remains tentative, with traders monitoring the dollar, Treasury yields, US election developments and employment data.
Why Are Oil Prices and Treasury Yields Driving Gold?
Oil prices declined around 1% on Tuesday, reaching their lowest levels in almost four weeks as markets weighed possible diplomatic progress involving Ukraine and Iran against continuing threats to energy supplies.
Lower oil prices can ease inflation expectations, potentially reducing the need for the Federal Reserve to maintain restrictive interest rates for an extended period. That can support gold if real yields and the dollar move lower.
Conversely, higher bond yields and a stronger US dollar can weigh on non-yielding bullion. Reuters reported that markets assigned approximately a 78% probability to a December Fed rate increase at the time of its early Wednesday update. This was market-implied pricing, not an announced policy decision.
The interplay between oil, inflation, bond yields and currency movements helps explain why gold can struggle even while geopolitical risks remain elevated.
World Gold Council: Official Buyers Remain Active
The World Gold Council’s Q3 2026 Gold Demand Trends report, released on November 3, showed total global gold demand including over-the-counter activity declining by 1% year over year to approximately 1,369 tonnes.
Yet demand from central banks and other official institutions increased sharply. Net purchases reached 321 tonnes, up 42% from the corresponding quarter of 2025. Accumulated buying over the first nine months of 2026 reached about 675 tonnes.
Physically backed gold ETFs attracted 211 tonnes of inflows during the quarter. In contrast, global investment in bars and coins declined 19% to 268 tonnes. Jewellery consumption fell 17% to approximately 313 tonnes.
This split matters: long-term institutional accumulation may remain firm even as households and smaller investors reduce their purchases because of high prices or uncertain price momentum.
Figures refer to separate demand and flow categories. Do not add these bars to derive total global gold demand. Source: World Gold Council.
Approximate tonnes, rounded to one decimal place. Combined demand includes investment bars and coins plus jewellery consumption in Egypt. Source: World Gold Council.
Egypt Defies the Global Bar and Coin Trend
Egypt was among the few major markets reporting growth in gold bar and coin demand during the third quarter of 2026. Investment purchases rose by 5% year over year to approximately 5.9 tonnes.
This stands in sharp contrast to the 19% global decline in the same category. The World Gold Council linked Egypt’s relative resilience to a weaker Egyptian pound, which increased gold’s appeal as a store of savings.
The wider picture is more nuanced. Egyptian jewellery demand declined 12% year over year to approximately 3.8 tonnes, reflecting pressure on household budgets. Combined investment and jewellery purchases amounted to around 9.7 tonnes, using rounded figures.
Higher bar and coin demand does not mean that all forms of Egyptian gold consumption increased. These are quarterly physical volumes, not local retail prices. The price of gold in Egyptian pounds also depends on exchange rates, premiums, manufacturing charges and local market conditions.
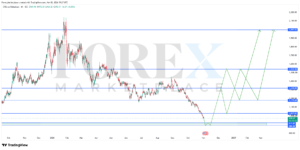
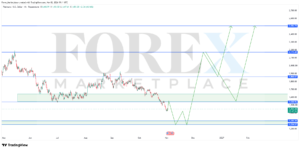
XAU/USD Outlook: Is $4,000 Back in Focus?
The $4,000-per-ounce threshold remains a closely watched psychological reference. However, a sustained move toward that level would depend on the dollar, real yields, monetary-policy expectations and investment flows.
Recovery scenario
Lower Treasury yields, a softer dollar or weaker-than-expected employment data could support bullion and improve the chances of another approach toward $4,000.
Downside scenario
Stronger US economic data, rising yields or additional Fed tightening expectations could revive selling pressure and limit gold’s recovery.
The $3,893.31 level cited by Reuters was an observed intraday low on Tuesday, not independently confirmed technical support. These scenarios are conditional market analysis, not trading instructions or price guarantees.
US Economic Calendar: Events Gold Traders Should Watch
- ADP National Employment Report for October. Private payroll data can influence the market’s expectations ahead of the official jobs release.
- ISM Services PMI. Traders will also monitor its employment and prices components.
- October Nonfarm Payrolls, unemployment rate and wage growth.
- October Consumer Price Index, an important release for assessing inflation and interest-rate expectations.
The schedule reflects announced release times at publication. Official calendars should be checked for any changes.
Conclusion: The Gold Market Remains at a Crossroads
Gold’s modest early-Wednesday gain follows considerable volatility, rather than a confirmed return to a lasting uptrend. Institutional buying and ETF demand provide a longer-term foundation, while dollar strength, Treasury yields and interest-rate expectations remain key short-term headwinds.
Egypt’s rising investment-bar demand illustrates the role of gold in household savings decisions, even as jewellery purchases decline. For global XAU/USD traders, the next major catalysts are US election developments and upcoming labor-market and inflation data.
Frequently Asked Questions
What was the gold price on November 4, 2026?
Spot gold was quoted at $3,934.75 per ounce at 00:24 UTC on November 4, according to Reuters. This is a dated market snapshot, not a live quotation.
Why does the US dollar influence gold prices?
Gold is internationally priced in US dollars. Currency movements can affect its affordability and investment appeal, alongside interest rates and real bond yields.
How much gold did central banks buy in Q3 2026?
Central banks and other official institutions purchased approximately 321 tonnes in Q3, according to the World Gold Council, bringing year-to-date buying to 675 tonnes.
Did Egyptian gold demand increase in Q3?
Investment bar and coin purchases increased 5% to about 5.9 tonnes, while jewellery demand declined 12% to approximately 3.8 tonnes.
Sources and Further Reading
- Reuters — Gold in early Asian trading, November 4
- Reuters — Gold and Treasury yields, November 3
- World Gold Council — Gold Demand Trends Q3 2026
- World Gold Council — Gold investment and Egypt
- World Gold Council — Jewellery demand
- US Bureau of Labor Statistics — November calendar
- ISM — Official PMI release calendar
Disclaimer: This article is provided for news and educational purposes and does not constitute personal investment advice. Market prices are historical snapshots and do not update automatically. Gold demand statistics are from the World Gold Council’s Q3 2026 report.