BTC/USD Technical Analysis — Long Setup from the Rising Channel
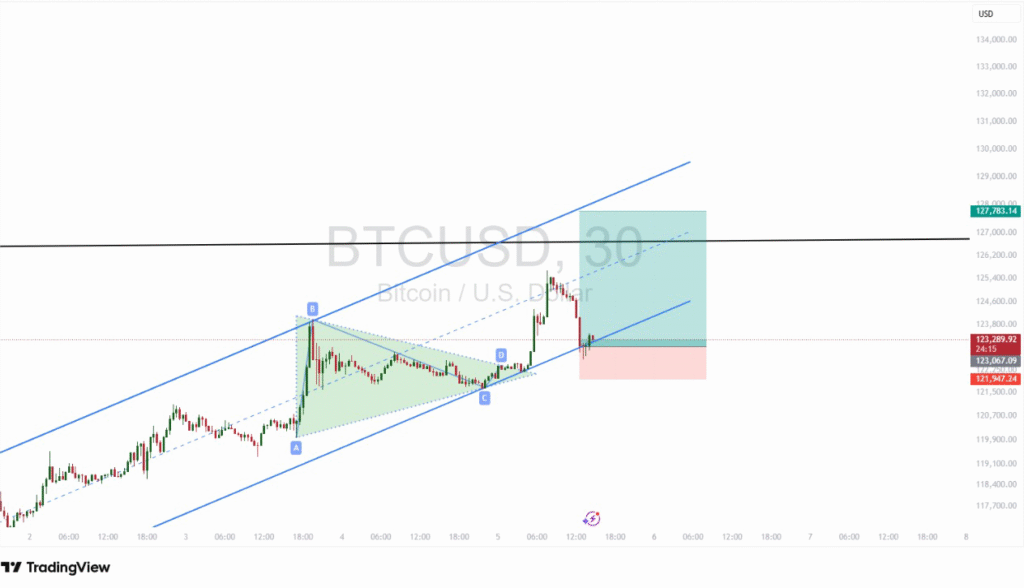
BTC/USD technical analysis on the 30-minute chart shows a rising channel with a completed harmonic pattern. The pullback to the lower channel boundary created a clean buy-on-dip opportunity, valid while the structure holds.
| Instrument | Bias | Key Levels | Trade Idea |
|---|---|---|---|
| BTC/USD | Bullish inside channel |
Buy zone: 123,200–123,600 Stop/Invalidation: 121,800 Targets: 126,800 (TP1) • 127,800 (TP2) • 129,500 (TP3) |
Buy dips at the lower channel • Partial exits at TP1/TP2 • Trail stops under higher lows. If H1 closes below 121,800, stand aside or short toward 120,600. |
Is the setup valid if BTC wicks below 121,800?
A brief wick is fine; only a body close below 121,800 invalidates the setup.
Where should I re-enter if stopped?
Look for a higher low above the channel base or retest of midline with a bullish candle.
What are the main profit targets?
TP1 126,800 • TP2 127,800 • TP3 129,500 (near top channel resistance).
How to manage risk here?
Keep position risk ≤2% and move stop to breakeven once price clears TP1.
Disclaimer: Price levels are taken from the chart provided (Oct 5, 2025). Refresh your platform quotes before trading.