

Oil Analysis September 14, 2026
Rising Channel Meets Resistance Near $103
Analysis date: September 14, 2026
Instrument: WTI crude oil CFDs — USOIL
Timeframe: One hour
Source: Supplied TradingView chart, CXM data, captured at 07:41 UTC.
Snapshot price: $99.213. This is not a live quote or the settlement price of a specified futures contract.
What Is the Oil Price Outlook?
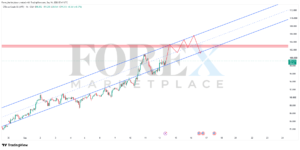
The chart shows a broader upward move and a rising channel, with price recovering toward its lower boundary after previously trading below it. Continued recovery depends on holding near approximately $98, followed by a move through $100–$101 toward horizontal resistance around $102.7–$103.2.
A renewed loss of the channel would weaken the recovery, especially if the recent low around $96 also breaks.
Price Action Analysis
Oil advanced from approximately $82 to a local high near $101, corrected toward $96, and then recovered toward the displayed price.
The channel slopes upward, but price has crossed below its lower boundary. Each touch should therefore be assessed rather than assumed to provide support. Holding inside the channel and forming higher lows would improve the recovery structure.
All zones below are approximate: the horizontal lines lack precise price labels, and channel levels change over time.
Support and Resistance
| Type | Approximate dollar range | Significance |
|---|---|---|
| Channel support near latest candles | $98.0–$98.5 | Dynamic support requiring confirmation |
| Nearby horizontal support | $95.5–$96.0 | Recent corrective low area |
| Lower support | $93.0–$94.0 | Previous price interactions |
| Nearby resistance | $100.0–$101.0 | Psychological level and local high |
| Main horizontal resistance | $102.7–$103.2 | Red horizontal band |
| Conditional upside extension | $104.5–$105.5 | Projected area dependent on breakout and timing |
Potential Setups
Rebound from Channel Support
Holding around $98.0–$98.5, followed by a higher low and a local breakout, could support a recovery toward $100–$101, then $102.7–$103.2.
A clear close below the channel and a failed recovery would weaken this scenario. A break of $95.5–$96.0 would increase the risk of a broader correction.
Continuation Above Resistance
An hourly close above approximately $103.2, followed by a successful retest, could support an extension toward $104.5–$105.5, subject to the upper channel boundary’s position at that time.
This projected area is time-dependent rather than a fixed channel target.
Resistance Rejection or Channel Breakdown
A clear rejection around $102.7–$103.2 could lead to a pullback toward the channel midpoint and then its lower boundary, depending on timing.
A channel breakdown and failed recovery could bring approximately $96 into focus, followed by $93–$94 if the recent low breaks. Reclaiming the channel and establishing a higher low would weaken the bearish scenario.
Interpreting the Red Projection
The red path illustrates alternating advances and pullbacks within the channel, including a resistance test, a possible breakout, and a later correction toward the lower boundary.
It does not establish the sequence, timing, or certainty of future moves.
Frequently Asked Questions
Is oil trending upward in the chart?
The broader slope is upward, but continued recovery needs support to hold and the local high near $101 to be overcome.
Where is the main resistance?
Approximately $102.7–$103.2.
Does channel support stay at $98?
No. That estimate applies near the latest candles; the sloping boundary rises over time.
Trading Risk Warning: This educational analysis is not personalized investment advice. Oil and CFD trading involve potential capital loss. Leverage, volatility, and slippage can increase losses. Chart levels and projected scenarios do not guarantee trading outcomes.