
Gold Analysis September 14, 2026
Downside Pressure Below $4,468 as $4,225 Support Matters
Analysis date: September 14, 2026
Instrument: Gold / U.S. Dollar — XAUUSD
Timeframe: One hour
Source: Supplied TradingView chart, OANDA data, captured at 07:09 UTC.
Snapshot price: $4,319.460 per troy ounce, not a live publication-time quote.
What Is the Gold Outlook?
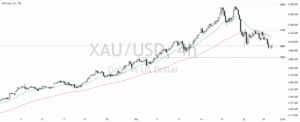
The chart shows lower highs following the earlier advance toward $4,700, supporting a short-term corrective bearish interpretation. $4,442.547–$4,468.483 remains the main resistance zone, while nearby support lies between $4,225.504 and approximately $4,245.
A confirmed support breakdown could open the way toward $4,101.285. Reclaiming the upper resistance zone would weaken the bearish scenario.
Price Action Analysis
A strong advance was followed by a sharp decline and recovery attempts that failed to regain the previous peak. Lower highs suggest that short-term rebounds continue to face selling pressure.
The displayed price is between the main support and resistance zones. The screenshot alone therefore provides no confirmed immediate entry. Potential setups depend on reactions at the boundaries or a confirmed break and retest.
Support and Resistance
| Type | Price per troy ounce | Significance |
|---|---|---|
| Nearby support | $4,225.504–approximately $4,245 | Potential rebound area; upper boundary is estimated |
| Next support | $4,101.285 | Reference after a confirmed nearby support break |
| Main resistance | $4,442.547–$4,468.483 | Key test of buyers’ ability to regain control |
| Estimated higher resistance | Approximately $4,500 | Previous local high area after a successful breakout |
Potential Setups
Corrective Rebound from Support
Rejection of lower prices within $4,225–$4,245, followed by a local hourly high breaking, could support a rebound toward approximately $4,319, then $4,442.547.
A clear close below $4,225.504 and failed recovery would weaken the setup. Any rebound remains corrective while upper resistance holds.
Resistance Rejection
A move into $4,442.547–$4,468.483, followed by a failed breakout and a local low breaking, could support a decline toward approximately $4,319, then $4,245–$4,225.
Holding above $4,468.483 and successfully retesting it would weaken this scenario.
Breakdown Toward $4,101
An hourly close below $4,225.504, followed by a failed retest from underneath, would support a possible extension toward $4,101.285.
Reclaiming support and holding above it would weaken the breakdown signal and could indicate a false break.
Alternative Bullish Scenario
Reclaiming the entire resistance zone and holding above $4,468.483 could support a recovery toward approximately $4,500. Further upside assessment requires additional price action or a broader timeframe.
Interpreting the Red Projection
The red path illustrates a decline toward support, a rebound into resistance, and a subsequent drop toward $4,101.285. The final leg requires nearby support to break. The arrows do not confirm the outcome or its timing.
Frequently Asked Questions
What is the main support area?
Approximately $4,225–$4,245, with an explicitly marked level at $4,225.504.
What would weaken the bearish scenario?
A sustained recovery above $4,468.483.
Is $4,101 a guaranteed target?
No. It is conditional on a support breakdown and failed recovery.
Trading Risk Warning: This educational analysis is not personalized investment advice or a guarantee of returns. Gold and metals trading involve potential capital loss, and leverage can magnify losses. Assess position size, execution risks, and scenario invalidation before making a trading decision.