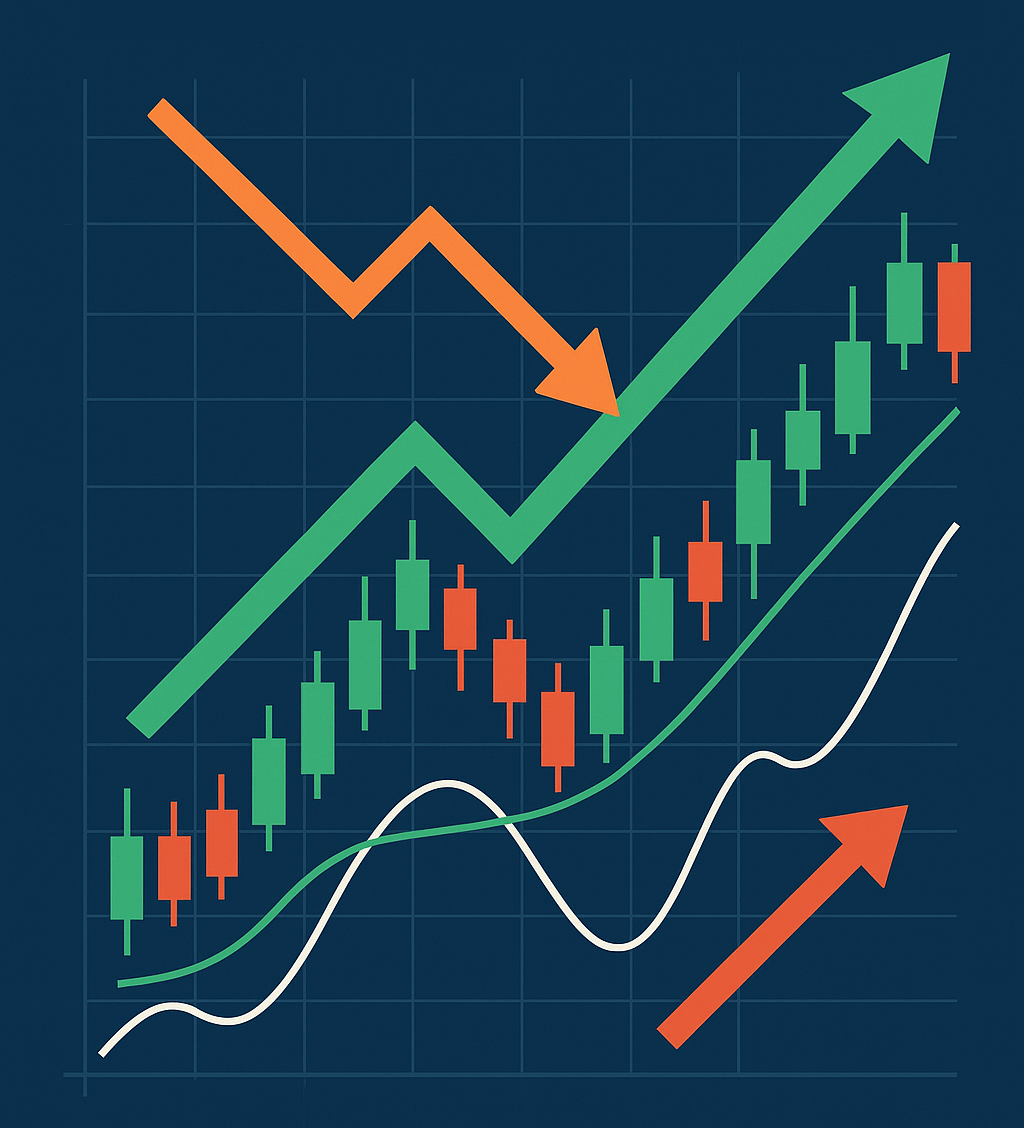
Introduction to Technical Analysis: Core Principles and Basics for Financial Markets

Technical analysis is often the first step for new traders trying to understand price action…
What Is Technical Analysis?
Simple Definition and Why Traders Use It
Technical analysis is the study of past price and volume patterns…
Comparing Technical vs. Fundamental Analysis
- Fundamental: What is the asset worth?
- Technical: How is price behaving now?
The Origins and Evolution of Technical Analysis
From Japanese Candlesticks to Dow Theory
Japanese merchants used candlesticks…
Modern Schools and Market Applications
The Three Core Principles of Technical Analysis
Price Discounts Everything
Prices Move in Trends
History Repeats Itself
Essential Charting Tools
Types of Charts
Support and Resistance Zones
Trendlines and Channels
Trading Volume as Confirmation
Must-Know Technical Indicators
Moving Averages (MA)
Relative Strength Index (RSI)
MACD
Reading Japanese Candlestick Patterns
Reversal Patterns
Continuation Patterns
Pros and Cons of Technical Analysis
Step-by-Step Lesson: How to Analyze a Chart
Choose Market and Timeframe
Identify Trend and Key Levels
Apply a Few Indicators
Build Entry/Exit Plan with Risk Management
Common Mistakes Beginners Make
Learning Path for Beginners
External resource: Investopedia
Frequently Asked Questions
Does technical analysis guarantee profits?
No—it improves probabilities but requires discipline.
Is it useful in all markets?
Yes, across stocks, forex, and crypto.
How many indicators should I use?
2–3 max. Focus on price action.
Which timeframe is best?
Depends on your trading style.
Are support/resistance levels precise?
No, they are zones.
How do I avoid false signals?
Look for confluence of signals.
Conclusion
Technical analysis isn’t a crystal ball—it’s a probability tool…
